
What Three Years of Blood Tests Can Tell You That One Can't
A single blood test shows where you are. Three years of results can show where you're heading.
· 4 min read
You get your annual blood work done. The results come back. Everything's in range. You file the report, feel reassured, and move on.
Now picture doing that three years in a row. You might feel the same reassurance, but what if a reading that you never doubted was gradually rising from 4.8 to 5.5 to 6.0? It’s no longer the same story.
That's the difference between a result and a trend. And it's the difference most people never see.
Most of us screen. Few of us track.
Singaporeans are, broadly, pretty good at getting tested. According to the Ministry of Health's 2024 National Population Health Survey (NPHS 2024), about 66% of eligible residents participated in chronic disease screening, back to pre-COVID levels.
But screening and tracking are not the same thing. A screening tells you where you stand today. Tracking tells you where you're heading. And almost nobody tracks; not because the data doesn't exist, but because each year's result is reviewed in isolation.
A normal result is not the same as a stable one
Every blood test comes with a reference range. If your number falls inside it, the report says normal. What it doesn't say is whether that number has been drifting upward for three years, or holding steady for a decade.
Take fasting plasma glucose (FPG), the primary screening marker for diabetes in Singapore. According to a 2018 study by the Ministry of Health and Tan Tock Seng Hospital, Singapore's clinical guidelines recommend FPG as the first-line screening test, with anything below 6.1 mmol/L considered normal. So a reading of 4.8 mmol/L and a reading of 6.0 mmol/L both fall under the normal threshold. But if your FPG has moved from 4.8 to 5.5 to 6.0 across three annual screenings, it's heading toward the 6.1 to 6.9 mmol/L range that signals pre-diabetes. Each year, you were told everything was fine. And each year, that was technically true. But the trend told a different story.
This isn't a flaw in the test. It's a limitation of how results are typically read — one at a time.
What patterns look like in practice
FPG isn't the only marker where direction matters more than position. A few others worth paying attention to across time:
LDL cholesterol. According to Singapore's MOH Clinical Practice Guidelines on Lipids, the optimal LDL level is below 2.6 mmol/L, with 2.6 to 3.3 mmol/L considered desirable. A reading of 2.8 mmol/L is well within range. But if it was 2.2 three years ago and 2.5 last year, it's worth asking what's driving the rise.
HbA1c. A 2023 study from the SingHealth Diabetes Registry, published in PLOS ONE, found that patients with high‑mean HbA1c trajectories displaying high variability had significantly greater risk of hospitalisation for heart failure, and this association was only clearly detectable when HbA1c values were tracked as longitudinal trajectories rather than assessed as single measurements.
Creatinine. A single creatinine result in range tells you your kidneys are functioning today. But a 2025 study in medRxiv demonstrated that tracking serial creatinine values within the normal range can detect early kidney function decline before it progresses to chronic kidney disease — a stage at which an estimated 90% of affected adults remain undiagnosed.
None of these markers raise alarms on any individual report. The signal lives in the sequence.
For chronic conditions, this matters even more
When you're managing a diagnosed condition like diabetes, hypertension, thyroid dysfunction, or chronic kidney disease, trend tracking isn't optional. It's the core of effective management. A single FPG or HbA1c reading doesn't tell your doctor whether your diabetes is well controlled over time. For chronic conditions, every test is part of an ongoing conversation with your body, and skipping the historical context means missing whether things are stable or slipping.
The same applies to anyone on long-term medication. Statins, metformin, and blood thinners affect your biomarkers, and the only way to know whether they're working as intended is to compare results across visits, not review each one in a vacuum.
How much data do you actually need?
You don't need a decade of records or a complete medical archive to start seeing meaningful patterns. Two consecutive results can show a direction. Three establish a trend. For most standard markers, three years of annual screening data is enough to reveal gradual shifts.
If you have reports from the last two to three years, you already have enough to work with. Begin with those.
The data exists, it's just not connected
Most people in Singapore who screen regularly already have years of blood test data. The problem isn't a lack of information. It's that the information is scattered across different clinics, different labs, paper reports in a drawer, and PDF downloads buried in email.
It’s difficult connecting the dots because the dots are in different places. The longitudinal view, which reveals whether you're stable, improving, or drifting, doesn't exist unless someone assembles it.
This is where technology can genuinely help. Health tracking apps and digital health lockers, including tools like Genie's Health Locker, allow you to upload past reports and organise your results into a timeline. Instead of flipping through old PDFs, you can see how each marker has moved across years, side by side.
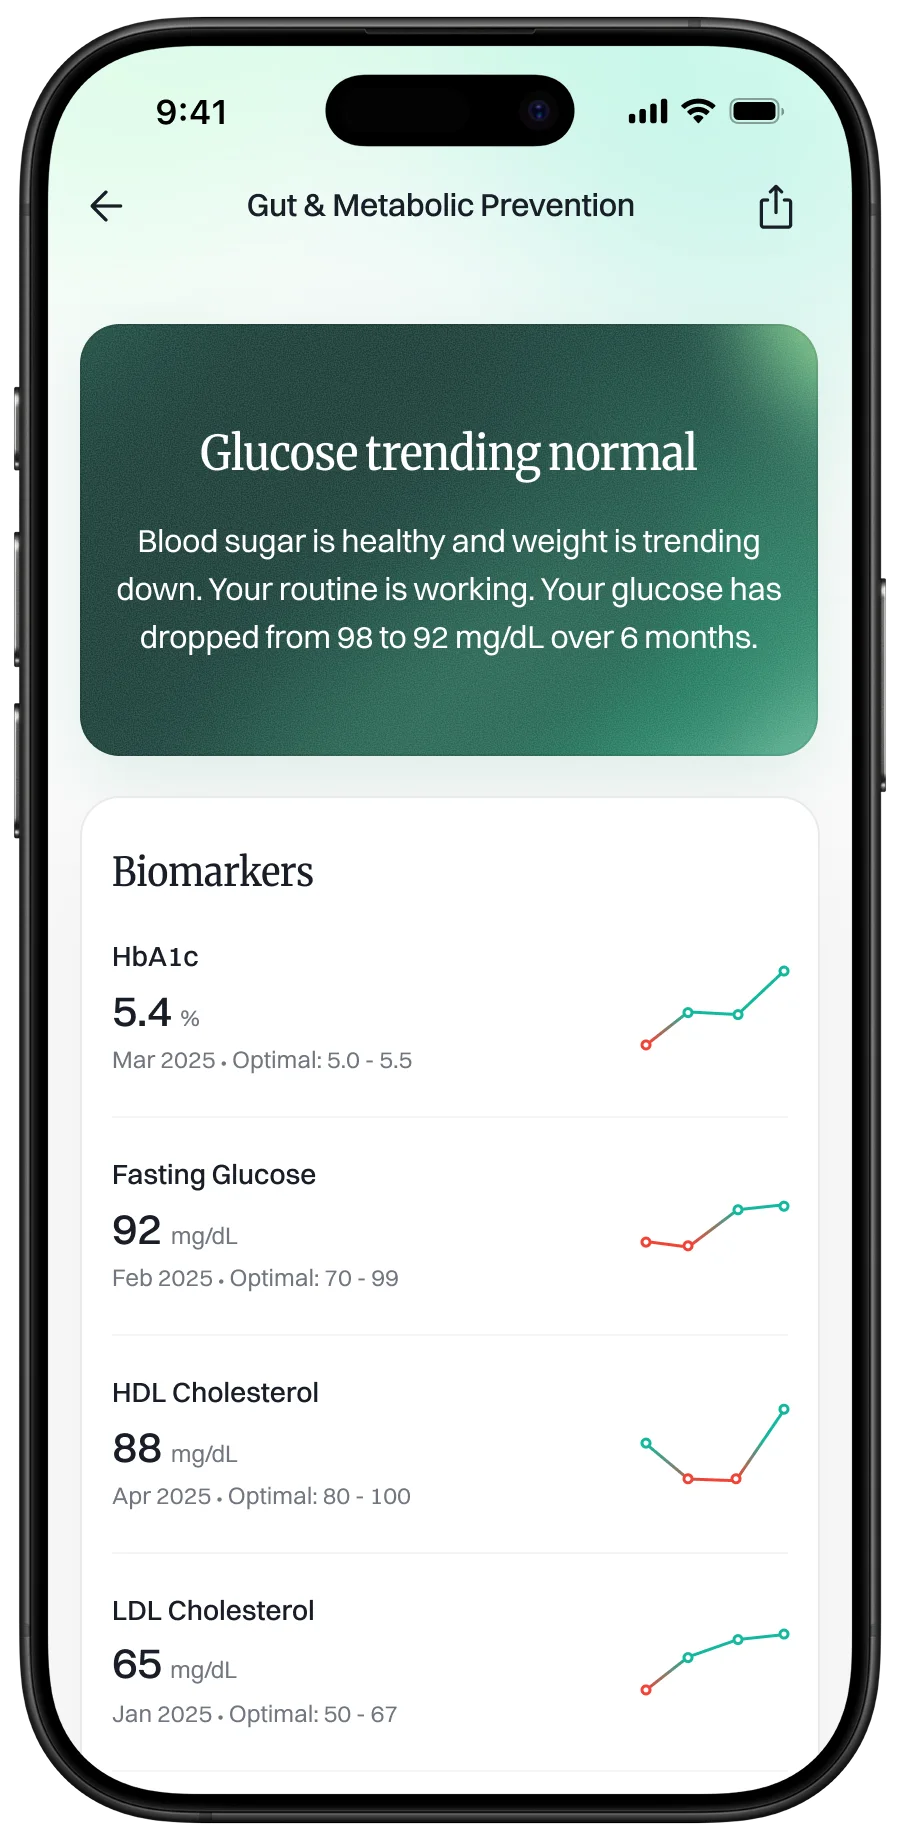
The step most people skip isn't the test, but bringing the results together. If you have even two or three past reports, uploading them is the fastest way to see what your screenings have been trying to tell you
FAQs
- Can blood test results change significantly from year to year?
- Yes. Biomarkers like cholesterol, blood sugar, and liver enzymes are influenced by diet, activity, medication, stress, and aging. That's exactly why comparing results across years is valuable. It reveals whether changes are temporary fluctuations or sustained trends moving in a concerning direction.
- Which blood test markers should I track over time?
- The most informative markers for longitudinal tracking include fasting plasma glucose and HbA1c (blood sugar control), LDL cholesterol (cardiovascular risk), and creatinine (kidney function). These are included in most standard health screening panels in Singapore. If you're managing a chronic condition, your condition-specific markers, such as TSH for thyroid disorders or eGFR for kidney disease, are equally important to track over time.
- How many years of blood test results do I need to see a meaningful trend?
- Three years of annual results is generally enough to identify a meaningful trend for most standard biomarkers. Two consecutive results can suggest a direction, and three confirm whether a shift is sustained. You don't need a complete medical history, just your most recent two to three reports in one place.
- Why doesn't my doctor usually discuss trends in my blood work?
- In a standard screening review, the focus is on whether each result falls within the normal range at that point in time. Trend analysis requires access to prior results, which isn't always available in a single consultation, especially if you've been screened at different clinics or labs over the years. Bringing your historical data together in a digital health tool can make it easier to have that conversation with your doctor.
References & Sources
- Ministry of Health, Singapore. "National Population Health Survey 2024." Press release, 17 October 2025. Chronic disease screening participation: 66.4% in 2024, returned to pre-COVID levels. https://www.moh.gov.sg/newsroom/national-population-health-survey-2024-shows-singaporeans-are-adopting-healthier-lifestyles---but-rising-obesity-is-a-concern/
- Lim WY, Ma S, Heng D, Tai ES, Khoo CM, Loh TP. "Screening for diabetes with HbA1c: Test performance of HbA1c compared to fasting plasma glucose among Chinese, Malay and Indian community residents in Singapore." Scientific Reports, 2018. Singapore clinical guidelines recommend FPG as first-line screening; normal FPG < 6.1 mmol/L. https://pmc.ncbi.nlm.nih.gov/articles/PMC6102285/
- Ministry of Health, Singapore. Clinical Practice Guidelines on Lipids, December 2016. LDL cholesterol targets: optimal < 2.6 mmol/L; desirable 2.6–3.3 mmol/L. http://www.smj.org.sg/sites/default/files/SMJ-58-155.pdf
- SingHealth. "Cholesterol: LDL, HDL & Management." Desirable total cholesterol below 5.2 mmol/L; desirable LDL below 2.6 mmol/L. https://www.singhealth.com.sg/symptoms-treatments/cholesterol-management
- Tan RY, et al. "Longitudinal HbA1c trajectory modelling reveals the association of HbA1c and risk of hospitalization for heart failure for patients with type 2 diabetes mellitus." PLOS ONE, 2023. SingHealth Diabetes Registry; 17,389 T2DM patients; HbA1c trajectories significantly associated with heart failure risk. https://journals.plos.org/plosone/article?id=10.1371/journal.pone.0275610
- Liebman SE. "Pre-chronic kidney disease — Serial creatinine tracks glomerular filtration rate decline above 60 mL/min." medRxiv, 2025. Serial creatinine within normal range can detect early GFR decline; ~90% of CKD adults remain undiagnosed. https://www.medrxiv.org/content/10.1101/2024.09.17.24313678v5.full
- Healthscreening.sg. "Cholesterol Levels Singapore: Testing & Treatment (2026)." LDL and total cholesterol reference ranges. https://healthscreening.sg/cholesterol-levels-singapore
Read Next: Spotting Fatty Liver: The Condition 1 in 3 Singaporeans May Have Without Knowing It
You might also like

Understanding Your Complete Blood Count
Your CBC is one of the most common blood tests in Singapore — yet most people collect the report and move on. Here is what the numbers actually mean, and why they matter more than you think.
Blood Health · · 5 min read

Why Your Cholesterol Reading Alone Is Not Enough
Total cholesterol is one of the most frequently checked markers in Singapore — and one of the most misunderstood. The number on your report tells only part of the cardiovascular story.
Blood Health · · 5 min read

Vitamin B12 Deficiency: A Common Blind Spot in Singapore's Health Screenings
B12 deficiency is more common than most people realise — especially among vegetarians, older adults, and anyone on long-term metformin. And it is rarely tested as standard.
Blood Health · · 4 min read